Assessing Tsunami Hazard Along Vancouver Islands West Coast Using Viewshed Analysis
Johnson, Davin R. E.
University of Lethbridge Lethbridge, Alberta, Canada
Abstract
Quick and reliable mapping of Tsunami hazard location and intensity is of great importance to mankind. The conventional methods for assessing these natural disasters rely on models that are both very time-consuming and costly. Unfortunately, these constraints give the models no possibility for evacuation planning to be used directly after a recorded event. This paper presents a new method using viewshed analysis for mapping the locations that will be affected by a Tsunami. The viewshed analysis was run from a hypothetical earthquake epicenter located 100km off the West Coast of Vancouver Island, BC, and overlain on a Digital Elevation Model (DEM) of Vancouver Island. Results show that Vancouver Island as a whole is relatively safe from Tsunami attack, but some of the more popular regions for tourists would be greatly affected and in need of immediate evacuation.
Citation
Assessing Tsunami Hazard Along Vancouver Islands West Coast Using Viewshed Analysis. Johnson, Davin R. E. . Lethbridge Undergraduate Research Journal. Volume 1 Number 1. 2006.
Introduction
A tsunami is one of the largest and most devastating naturally produced hazards known to man. Tsunamis can savagely attack coastlines, causing disastrous property damage and loss of life. The word Tsunami comes from the Japanese “tsu” and “nami” meaning harbour and wave respectively (Cook 1995). The wave is named this because it is large enough to breach harbour break walls wreaking havoc to coastal and marina areas. These large scale waves can affect vast areas of coast all at once with virtually no warning as witnessed in the December 26th 2004 tsunami that occurred in the Indian Ocean. From such an event, loss of life as well as the destruction of infrastructure and environmentally sound areas is inevitable.
Tsunamis are prone to occur anywhere in the world where two tectonic plates meet under the ocean. Some one hundred kilometers off the west coast of Vancouver Island exists the Cascadia Subduction Zone, here the Juan de Fuca plate is continually moving in a northeastern direction causing pressure under the North American Plate (Figure 1). From stress and pressure the plates become lodged together which in turn causes a megathrust earthquake (Hyndman et al. 2001). This megathrust earthquake abruptly displaces the ocean floor and in turn the overlying water to cause one or more tsunami waves. The waves generated can reach onshore run-up heights of up to thirty-meters, causing mayhem to coastal landscapes and communities.
Much of British Columbia's Old Growth forests and tourism exist on the west coast of Vancouver Island. These are of the largest sources of income for the province, and therefore there has been an increasing concern over the possible occurrence of a tsunami, and the effects that may come forth with such an event. The study performed introduces a new possibility of assessing tsunami events based on a model using viewshed analysis. By running and overlaying a series of viewsheds with differing parameters from a known earthquake epicentre then comparing this with a classified Landsat image, we can quickly determine the areas affected by tsunamis of varying magnitudes.
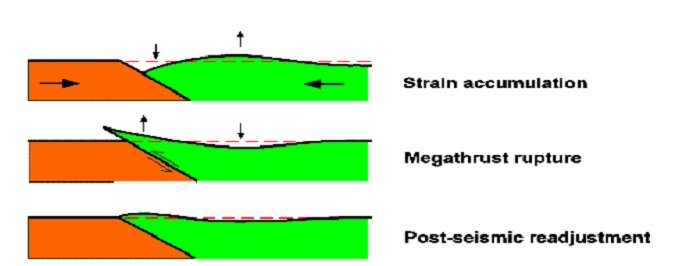
Figure 1: Diagram illustrating the movement of the Juan de Fuca Plate and North American Plate and where a megathrust earthquake might occur (Hyndman et al 2001).
Background
Tsunami Development
Tsunami waves can occur from several events such as asteroid, meteor or comet impact, submarine/terrestrial landslides, submarine/terrestrial volcanic eruptions, or in the most likely scenario a megathrust earthquake. Megathrust earthquakes are formed from a build-up of stress between two crustal plates. There is an accumulation of strain with the over-riding plate, causing it to buckle. The buckle then releases, causing the sea floor to deform abruptly and vertically displace the overlying water, generating a series of tsunami waves (Figure 2) (Hyndman et al 2001).
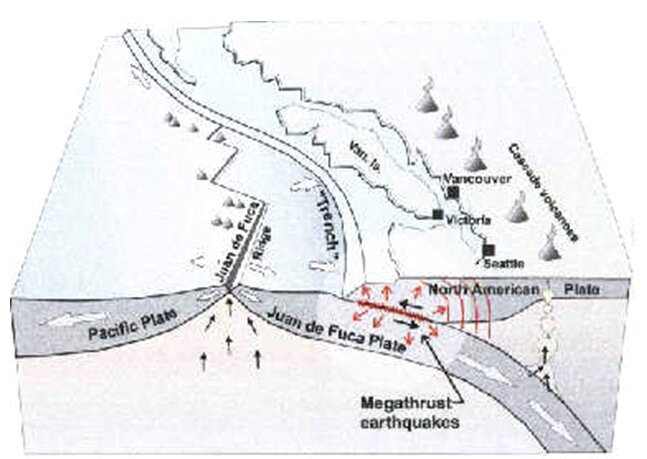
Figure 2: Deformation cycle in a subduction related megathrust zone (Fisheries and Oceans Canada 2001).
Viewshed Analysis
Baldwin and Fisher (1996) define viewshed as “two locations in a landscape are said to be in view from each other if they enjoy an uninterrupted view of each other”. When one location is specified as the viewing location, and the visibility of all other locations in the study area is analysed, the resulting map of the study area is known as the viewshed or the visible area (Figure 3).
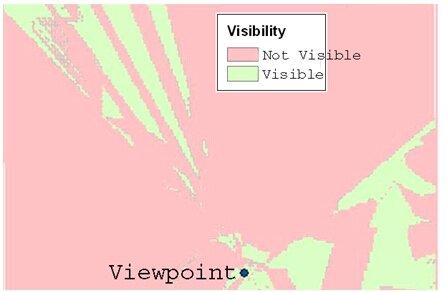
Figure 3: Viewshed map delineating visible areas and non-visible areas from the viewpoint.
Viewsheds radiate out in an arc like fashion from the viewpoint as they are being computed (Lee 1991, Sorensen and Lanter 1993) much like the propagation of a wave from its focal point. Therefore given the location of the epicentre of a megathrust earthquake, a viewshed analysis can be run from that epicentre to determine possible areas affected by the resulting tsunami. There are nine different parameters that can be altered to set the area under subjection for visibility, listed by ESRI (Figure 4) as follows:
- SPOT heights are the elevations of the surfaces where the viewpoints are situated. “
- VERT1 and VERT2 are the vertical angles set to view between, from 90° (straight up) to 0° (horizontal) and 0° (horizontal) to -90° (straight down).
- AZIMUTH1 and AZIMUTH2 are the starting and ending horizontal angles which determine the side swath, 0° = North, 90° = East, 180° = South, 270° = West.
- OFFSETA and OFFSETB are the heights above the surface elevation given to the viewpoint and target pixel under subjection for visibility.
- RADIUS1 and RADIUS2 are the distances away from the viewpoint delineated to begin and finish the visibility computation.
By altering the viewing parameters, a simulation of wave visibility can be performed, in other words, what the wave can see and ultimately reach will be what is visible in the viewshed map.
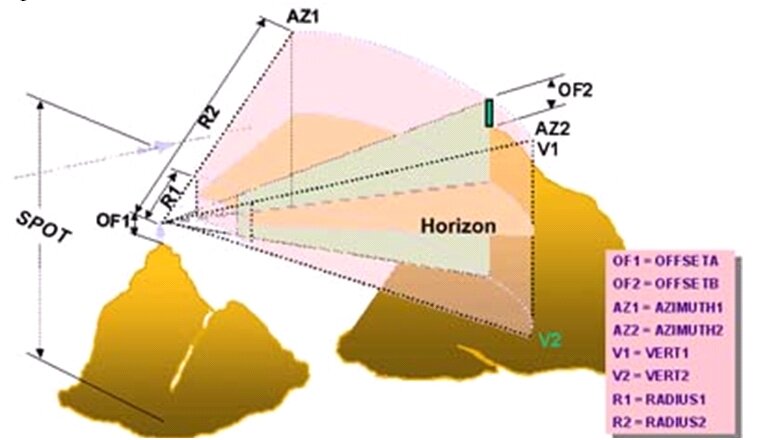
Figure 4: The image graphically depicts how a viewshed is performed with the nine parameters that can be changed (ESRI ArcGis Viewshed Documentation).
Performing a supervised classifications on recent Landsat 7 images of the study area, will divide the image into areas of equal pixel reflectance values. Because maximum likelihood classification assumes that the statistics for each class in each band are normally distributed it calculates the probability that a given pixel belongs to a specific class. Each pixel is assigned to the class that has the highest probability hence the “maximum likelihood” (Wentzell, Lohnes 1999). Thereafter a cost is set to each class based on least to highest hazard. The viewshed maps overlaid with the resulting classified Landsat images are used to derive a final hazard assessment for the area.
Study Area
The viewshed analysis was performed for a region from Tofino to Ucluelet (Figure 5) on Vancouver Island using a known earthquake epicentre from 1996 as the viewpoint. This area was chosen for study because of the large urban population and old growth forests that are in contact with the coastline. These two factors are very sensitive to the impacts of a tsunami, thus areas containing either are in great need of hazard assessment.
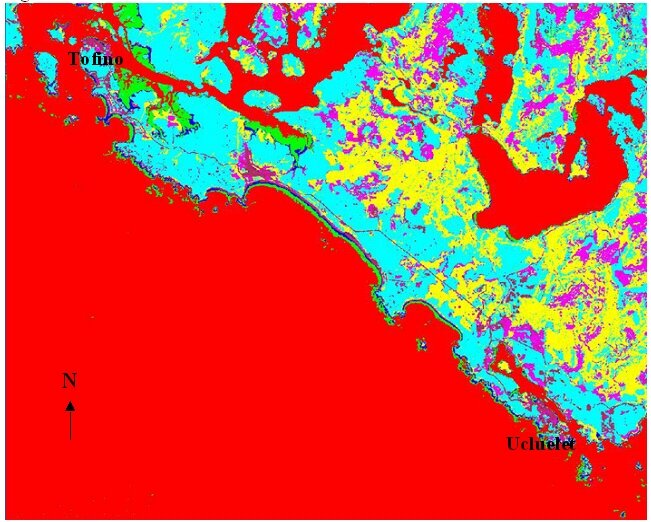
Figure 5: Study area from Tofino to Ucluelet reclassified for hazard assessment.
Methods
A combination of the viewshed analyses and classified Landsat images when added together give a map to determine most hazardous areas. Several viewsheds with varying parameters are run on the study area from the known earthquake epicenter. This is compared with the classified Landsat image to derive not only affected areas, but areas affected that will accumulate the largest impact. Densely populated urban areas should be considered to be at much higher risk than bare desolate beaches. Loss of life is much more significant, than change in sand bar levels.
Viewshed analysis was used to determine the possible areas of tsunami wave destruction; this is because it gives a quick view of what the wave can see. The idea for using viewshed analysis in this study is that the crest of the breaking wave is as high of an elevation that a wave could ever reach on land; this then can be used as a viewpoint in the viewshed analysis. By placing the viewpoint at the epicentre of the known earthquake location, and raising the offset to thirty-meters (height of the crest of the breaking wave), and limiting the horizontal view angle of the viewshed, we determine the maximum vertical distance that waves of varying heights can reach on the thirty-meter Digital Elevation Model (DEM) of Vancouver Island (Figure 6).
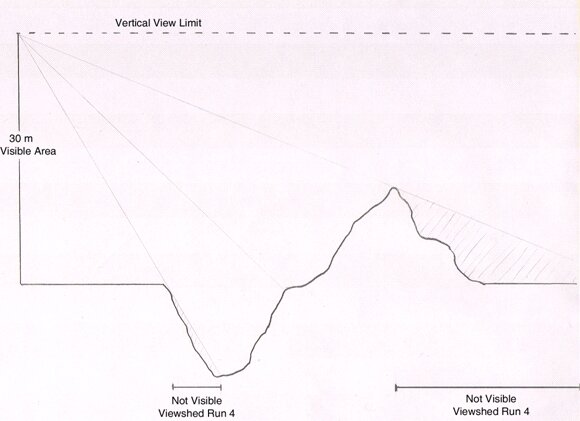
Figure 6: Cross-section of hypothetical viewshed showing non-visible areas with viewpoint offset 30m and target pixel offset 0m.
An AML Script was used to run the viewshed (ESRI ArcView GIS 3.2 Help). It accesses the selected viewpoint and compares this with the specified DEM to derive viewshed based on the parameters in the viewpoints feature table. No automation is incorporated therefore the parameters have to be changed for each consecutive run. The script was produced for Arcview GIS 3.2; ArcGIS 9 does not have the ability to change the parameters within the viewshed analysis.
There were five separate viewshed analyses performed, each for separate parameter sequences where the Offset of the viewpoint and target pixel was changed each time (Table 1). A summary of the viewsheds run is as follows.
- The first run was to determine base heights for later comparison.
- The second and third runs of 1m were done to determine whether or not the AML Script was running properly and could distinguish elevation change in the DEM.
- The fourth and fifth runs of 30m were performed to simulate the coastal areas that might be affected by a tsunami with wave heights up to thirty-meters.
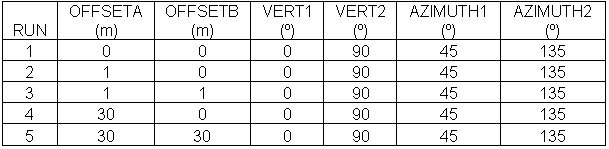
Table 1: Parameters used for each run of viewshed analysis.
The viewshed maps derived from runs two and three were added, and runs from four and five were added. This was done to take into account low-lying areas in the DEM. It is known that two points are defined as being visible to each other if a straight line can be drawn between the points without intersecting any part of the terrain surface between them (Lee 1991, Sorensen and Lanter 1993), lower dips in the DEM would be considered not visible (Figure 6). But it is also known that as a wave travels it will fill lower regions as it travels, therefore lower lying areas are corrected by running a viewshed with OffsetB or target pixel offset as thirty-meters (Figure 7). This also corrects for raised terrain features that will create non-visible pixels behind them (Figure 6). The two viewsheds then being added together will fill the low-lying areas and correct for the raised terrain features.
A Landsat 7 image acquired in June of 2000 of Vancouver Island was used for the classification of areas at risk. The image was first reduced to the study area from Tofino to Ucluelet on the west coast of the island using a mask within ENVI. From this a supervised classification was performed, 7 classes (Urban, Treeless, Replant, Old Growth, Sand or Beach, Shallow Water, and Deep Water) were produced using the maximum likelihood algorithm using bands 2, 3, and 4 (Figure 5).
The derived classification of the study area was compared with the thirty-meter viewshed obtained to determine a hazard assessment for the surrounding old growth areas and urban populations.
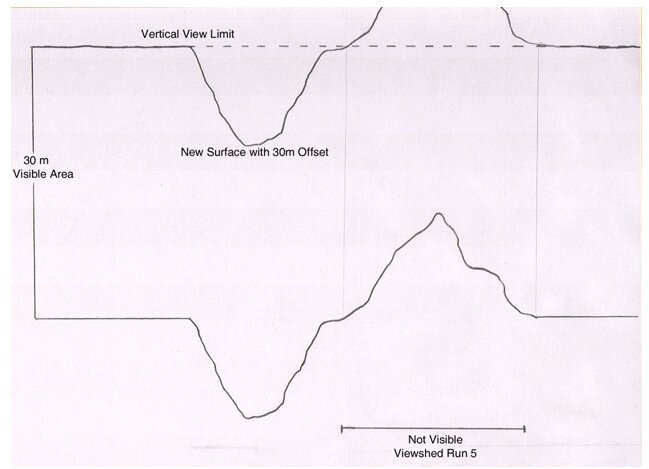
Figure 7: Cross-section of hypothetical viewshed showing non-visible areas with viewpoint offset 30m and target pixel offset 0m.
Results
The initial viewshed with offset of zero-meters (from here on referred to as R1), mapped only ocean areas on the DEM as visible. This proved that the AML script was working correctly because the viewshed analysis could distinguish the boundary between land and water or the area where the DEM elevates above zero-meters. When comparing the viewshed of R1 to the viewshed with offset of one-meter (from here on referred to as R2), it was determined that the parameter changes were working correctly. Little difference was made as would be expected, but there were differences detected none-the-less (Figure 8).
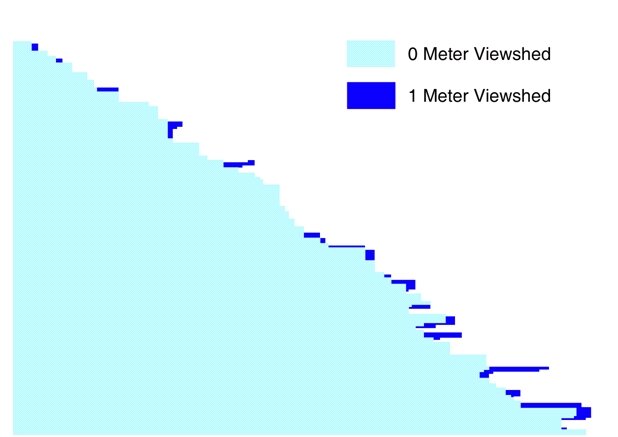
Figure 8: Difference of viewsheds with 0m and 1m offsets.
The viewshed with offset of thirty-meters (from here on referred to as R3), mapped a much greater area of visibility than that of R2. The visibility travelled much further inland, but as a result of this an error was produced. There were several areas in the viewshed map that were in the shadow of a terrain feature, therefore not visible, but were mapped as visible. As viewshed defines, any pixel in the shadow of another pixel is in turn not visible. This problem arises mainly in the outlined Ucluelet region (Figure 9).
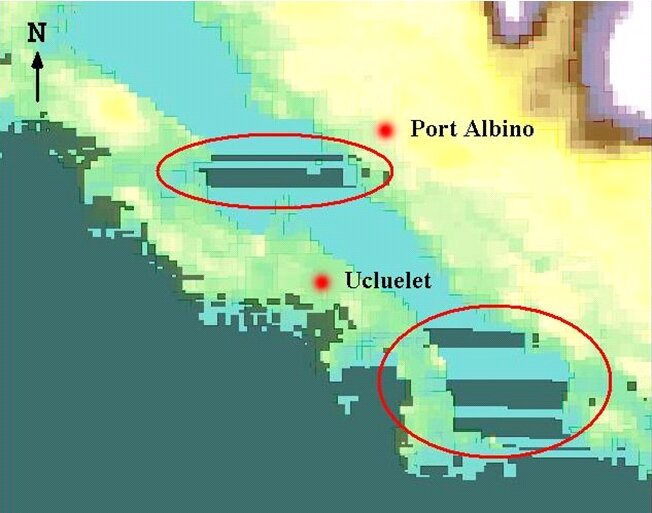
Figure 9: Circled area on DEM with viewshed overlaid to demonstrate areas of error.
After overlaying R3 with the classified Landsat image, it was determined that the study area is relatively unaffected by the occurrence of a tsunami. Some populated areas along the western end of Tofino and Ucluelet were mapped as visible from R3, along with areas throughout Long Beach (Figure 10).
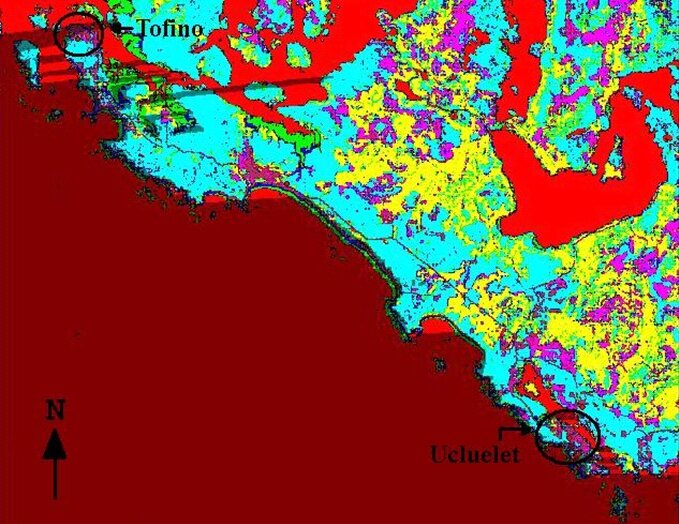
Figure 10: Final thirty-meter viewshed overlaid with classifies Landsat image for hazard assessment.
Discussion
The results of the thirty-meter viewshed were not as expected. It was hypothesized that the thirty-meter runs would indicate much greater inland visibility than actually achieved. This discrepancy is most likely due to the resolution of the DEM used for the study. Having used a thirty-meter grid cell size, change in topography is most likely depicted as being more gradual than that of the actual terrain. A better resolution DEM would be preferable for more detailed studies.
No viewshed analysis is able to take into account the interactions between water and a surface. Tsunamis, like all waves have the ability to reach the backsides of obstructions by refraction, reflection and diffraction. Diffraction occurs as waves pass a structure (i.e. island or a jetty) and energy is propagated around the structure causing the wave to “wrap” around the structure (Nelson 1996). The viewshed analysis does not assess the implications of backwashing and wrap around effects that occur with water movements around islands or jetty's (Figure 11). Because of this, the viewshed cannot account for these phenomenon, it only determines the visibility of pixels based on linear transects from the viewpoint. These effects must therefore be taken into account along with the viewshed analysis in the final coastline hazard assessment.
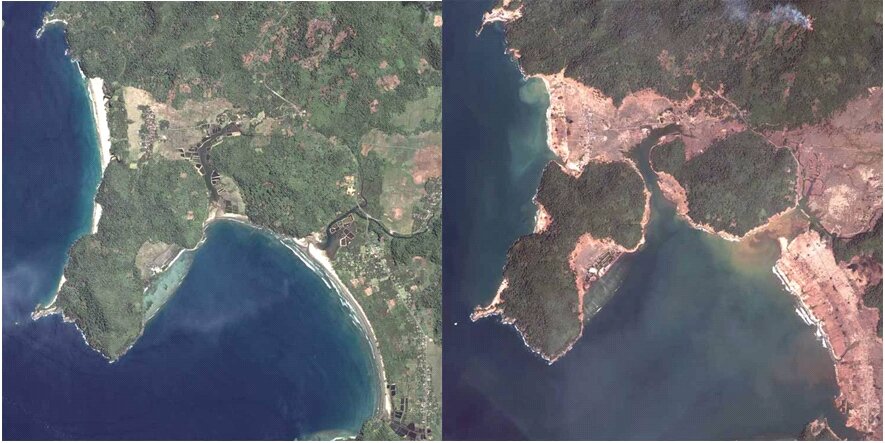
Figure 11: Before and after Spot images of December 26th tsunami, showing “wrap around” effect of tsunami on a Jetty and Bay, Indonesia (http://www.infoplease.com/spot/tsunami.html).
The error produced in viewshed R3 can be accounted for during the analysis, and therefore corrected. The analysis predicted that the ocean and the front part of the island up to a height of thirty-meters are visible and those areas further along are not visible, this is known to be correct. Yet continuing further along to the areas where ocean occurs again is said to be visible, when in reality this should not be visible because it is in the shadow of a raised terrain feature (Figure 6). This problem occurs because R3 was created by adding two viewsheds. When adding runs four and five (Table 1), all non-visible areas on one viewshed that are visible on the other are converted to visible, and all areas that are non-visible on both are kept non-visible (Figure 12). This works like a conditional statement:
If the pixel is found to be visible on at least one viewshed, make visible; Else remain non-visible.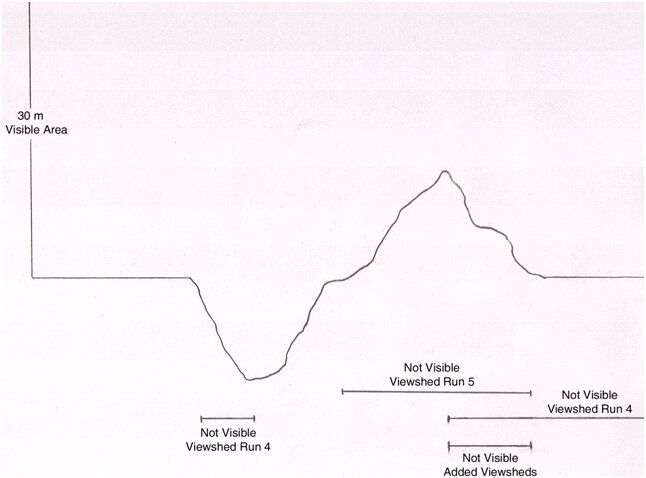
Figure 12: Cross-section of hypothetical viewshed showing non-visible areas of both viewsheds added together.
In this aspect, runs three and five (Table 1) help the viewshed analysis, in correcting for errors in low-lying topography, but can create errors in shadowed regions by raising the terrain surface above the allowed viewable area (Figure 7). Because we know the source of this error, it can be accounted for and these areas can therefore be ignored as being visible and be considered non-visible. This correction must only be considered after comparing the areas of presumed error with the classified Landsat image. In doing so, only assumed errors in ocean areas are removed, and therefore new errors on the land surface are not introduced because of false correction.
Conclusion
Tsunamis can be one of the most destructive natural forces on earth, and pose a great threat to all sorts of environments. In the past models have been produced to determine such things as tsunami intensity, tsunami wave propagation and run-up distances of the tsunami waves. These models can only determine where a tsunami might reach, and deal with very small study areas due to the intense computations required for the models. Little has been done for hazard assessment of large coastal areas, and the actual inland areas reached by the tsunami.
As an alternative to these modelling techniques, viewshed provides a good assessment of potential coastal areas at risk from tsunamis. It offers a relatively quick and simple perspective of areas to be considered for further examination as potential hazard areas. Although the results of the viewsheds determined that the area under subjection for study is relatively safe from tsunami attack, the analyses did prove to be useful. The most populated and visited area of Vancouver Island would be relatively unaffected by the occurrence of a tsunami wave, according to this study; but as mentioned before factors such as the resolution of the DEM need to be taken into account, and therefore a finer resolution DEM would produce more reliable results.
Megathrust earthquakes are an unavoidable natural hazard, yet their destructiveness can be reduced to modelling, well planned infrastructure and an informed public. The methods in this study must be considered a starting point for coastal hazard assessment due to tsunami impacts. The viewshed analysis is an efficient method to determining general areas of tsunami destruction. As the method is applied to other regions, refinements can be added or procedures changed as needed. It is suggested that future models use higher resolution DEM's, this will enable a more precise assessment of coastal areas affected by tsunamis.
Acknowledgements
I would like to thank S. Lapp and J. Montain for providing the data for the project and support of the data as well as Dr. Craig Coburn for his extensive help in planning and problem solving during the study, as well as his input to greatly improve the presentation of this paper.
References
BALDWIN, J., FISHER, P., WOOD, J. and LANGFORD, M. (1996) Modelling Environmental Cognition of the View with GIS http://www.ncgia.ucsb.edu/conf/SANTA_FE_CDROM/sf_papers/fisher_peter/baldwin.ht
BUNDGAARD, H.I., WARREN, I.R. and BARNETT A. (1991) Modeling Tsunami Generation and Runup. Science of Tsunami Hazards 9, 23-30
COOK, B. et al. (1995) http://www.ess.washington.edu/tsunami/index.html
DUNBAR, D., LEBLOND, P. and MURTY T.S. (2003) Evaluation of Tsunami Amplitudes for the Pacific Coast of Canada. Progress in Oceanography 26, 115-177
ERGIN, A. and BALAS, C.E. (2002) Reliability-Based Risk Assessment of Rubble Mound Breakwaters Under Tsunami Attack. Journal of Coastal Research 36, 266-272
HYNDMAN, R. D. et al. (2001) http://gsc.nrcan.gc.ca/geodyn/mega_e.php
KARAMBAS, T.V., KRESTENITIS, Y. and KOUTILAS, C. (1991) Numerical Model on Tsunami Propagation. Science of Tsunami Hazards 9, 63-72
KOWALIK, Z. (2001) Basic Relations Between Tsunami Calculations and Their Physics. Science of Tsunami Hazards 19, 99-115
KOWALIK, Z. (2003) Basic Relation Between Tsunamis Calculation and their Physics II. Science of Tsunami Hazards 21, 154-173
LEE, J. (1991) Analyses of Visibility Sites on Topographic Surfaces. International Journal of Geographic Information Systems, 5(4):413-429.
MALOY, M.A., and Dean, D.J. (2001) An Accuracy Assessment of Various GIS-Based Viewshed Delineation Techniques. Photogrammetric Engineering and Remote Sensing, 67(11):1293-1298.
MYERS, E.P. and BAPTISTA, A.M. (1999) Finite Element Modeling of Potential Cascadia Subduction zone Tsunamis. Science of Tsunami Hazards 17, 3-18
SORENSEN, PAUL A., and LANTER, D.P. (1993) Two Algorithms for Determining Partial Visibility and Reducing Data Structure Induced Error in Viewshed Analysis. Photogrammetric Engineering & Remote Sensing,53:1423-1430.
WALTERS, R.A. and GOFF, J.R. (2003) Assessing Tsunami Hazard Along the New Zealand Coast. Science of Tsunami Hazards 21, 137-153
P.D. WENTZELL and LOHNES, M.T. (1999) Maximum likelihood principal component analysis with correlated measurement errors: theoretical and practical considerations. Chemometrics and Intelligent Laboratory Systems, 45:65-85.
WHITMORE, P.M. and SOKOLOWSKI T.J. (1996) Predicting Tsunami Amplitudes along the North American Coast From Tsunamis Generated in the Northwest Pacific Ocean during Tsunami Warnings. Science of Tsunami Hazards 14, 147-166
ZAIBO, N., PELINOVSKY, E., KURKIN, A. and KOZELKOV, A. (2003) Estimation of Far-Field Tsunami Potential for the Caribbean Coast Based on Numerical Simulation. Science of Tsunami Hazards 21, 212-222