An Examination of the Effects of a Curriculum Based Pedometer Program in Two Age Groups: Adults and Pre-Adolescent Children
Rweru, Fred
Berea College Berea, Kentucky, USA
Abstract
Recognizing that obesity and lack of physical activity are a foundation for other ailments, there is an increasing trend to promote physical activity and reduce obesity in the general populace. Pedometers are being used by the public in an attempt to quantify and also help motivate physical activity. This study attempts to examine the results of a curriculum-based pedometer program carried out by pre-adolescent students and their teachers in an elementary school in Berea, Kentucky over a period of ten weeks.
Citation
An Examination of the Effects of a Curriculum Based Pedometer Program in Two Age Groups: Adults and Pre-Adolescent Children. Rweru, Fred . Lethbridge Undergraduate Research Journal. Volume 2 Number 2. 2007.
Introduction
With the rising cost of health care, obesity and overweight issues continue to come under increasing scrutiny. Obesity increases the risk of other health problems like high blood pressure and Type 2 Diabetes, to mention a few (National Conference of State Legislatures, 2007). One is considered “obese” when their body mass index (BMI) is 30 or over, and “overweight” when their BMI is between 25 and 29.9 (National Conference of State Legislatures, 2007). In the last two to three decades obesity has increased dramatically. The State Legislatures report adds that 60.5 percent of adults were overweight and 30 percent obese as of 2005. It is in this light that attempts are being made to increase the level of physical activity in the general populace.
Literature Review
Wilmore & Costill (2004) differentiated between the terms “overweight” and “obesity.” “Obesity” and “overweight” while related are different. The former involves having an excessive amount of body fat while the latter involves a body weight that exceeds the standard weights for the given size of the person (Wilmore & Costill, 2004). The expenditure on healthcare in the United States according to the National Center for Health Statistics was $1.9 trillion in 2004 (http://www.cdc.gov/nchs/fastats/hexpense.htm). Health and Physical Activity have gained prominence with the role of Physical Activity in a healthy life becoming increasingly clearer. Yet the Centers for Disease Control and Prevention (CDC) estimate that in spite of this knowledge “over half of US adults do not engage in Physical Activity at levels consistent with public health recommendations,” as per the Morbidity and Mortalities Weekly Report (MMWR). (http://www.cdc.gov/mmwr/preview/mmwrhtml/mm5232a2.htm).
Oliver, Schofield, and McEvoy (2006) and Wilmore and Costill (2004) have done quantification and study of the effects of physical activity in adults and children with factors like the level of physical activity in boys and girls being scrutinized. Patrick L. Schneider et al. (2006) studied the effects of a 10,000 steps per day goal in overweight adults. Their findings were that adherence to such a program resulted in weight loss in their previously sedentary subjects (Patrick L. Schneider et al., 2006). The obesity crisis has not spared the younger population either. A variety of strategies like Pedometer programs are being employed to improve both child and adult physical activity. The National Health and Nutrition Examination Health Survey of 2003-2004 indicate that the rate of child and adolescent overweight has increased since 1970. (http://www.cdc.gov/nchs/products/pubs/pubd/hestats/overweight/overwght_child_03.htm).
The State Legislatures report issued by the National Conference of State Legislatures in 2003 adds that “in every state at least 15% of the adult population is obese.” (State Legislatures 2004.) According to the same report with figures from the North American Association for the Study of Obesity using figures from the Behavioral Risk Factor Surveillance System (BRFSS), Kentucky spent $1.637 billion in medical costs related to obesity in 2004. He and Baker, 2004 also did a study that examined the relationship between body weight and general health with body weight being established as an indicator of general health. The same study finds that physical activity amongst overweight subjects still has a positive effect on their weight. Also, community based efforts are being made to encourage physical activity. Among these are construction of living communities that are physical activity-friendly with facilities like parks, community centers, walk ways, and bike routes. (Fenton, S115).
The present study will examine the effect of a 10 week pedometer program in two groups, adults and pre-adolescent children undergoing a curriculum based pedometer step program. It is hoped that examination of the results from these two subject populations will further aid the understanding of the role of pedometer aided physical activity in both adults and children. With the increasing knowledge of the challenges of obesity and efforts to stem the problem, there is need to understand the effectiveness of the strategies that are being employed. This study will shed some more light onto pedometer aided physical activity with a view to making it even more effective.
Methods And Procedures
The population was 4th grade students, their teachers, and four parents at Shannon Johnson Elementary School in Berea Kentucky. The teachers and students were involved in the Walk Smart Active Schools Step Program, (http://www.walksmartactiveschools.com). The program is curricular web-based and documents how much exercise subjects do in the form of steps taken. Adult subjects read and signed a consent form before they participated in the program, and also signed another consent form prior to post-evaluations. Pre-adolescent subjects participated in the program as part of their school curriculum. The sample was 31 adults and 75 students. The adults' ages ranged from 25 to 56 years, with 27 being female and three male. The children's ages ranged from 9 to 11. The instruments used included lap counters, pedometers, and heart rate monitors. The subjects were assessed both before and after the program to examine relative improvements, and not interventions were administered during the program. Pre-adolescent subjects were pre-assessed by measuring their running repetitions in the pacer test, weights, ages, height, and birthdates for both pre and post measurements, in order to calculate their BMI using the Centers for Disease Control Website online BMI calculator. For the adult subjects, their weights were not taken due to the reluctance of most adult subjects to disclose this information. Hence, no BMI analyses were done for adult subjects.
Thus, adult pre measurements were their laps completed in twelve minutes, age, and beginning and ending heart rates, for post and pre-measurements. The subjects carried a lap-counter which they pressed each time a lap was completed. Their heart rates were read off their heart rate monitors prior to commencement of their laps. After each subject had walked for twelve minutes, their heart rate was read off immediately and their number of completed laps recorded. These procedures were repeated for post measurements after the ten week program. During the program the subjects, both adults and pre-adolescents, recorded their daily steps as measured by their pedometers at the Walk Smart Active Schools website. The pre and post-data were collected and analyzed to study any changes and effects during the ten week period.
Results
Out of the 75 pre-adolescent subjects pre-tested, 21 had incomplete data and were dropped from the study, representing a response rate of 72%. Out of 31 adult subjects 11 had incomplete data which was not used, representing a response rate of 67%. Among adult subjects there was no significant increase in average beginning heart rates, ending heart rates, and number of laps completed in the 12 minute walks as indicated by figures 1 and 2. The t-test between pre and post beginning heart rates produced a p value of 0.46, indicating no statistical difference between the two parameters. The pre and post ending heart rates returned a p value of 0.26 indicating no statistical change in the pre and post ending heart rates despite the appearance of slight increases as indicated in Figure 2. The number of laps completed also showed a p value of 0.15 indicating no statistical difference in pre- and post- numbers of laps completed by the subjects. The standard deviation of the pre-beginning heart rates was 13.74 beats per minute compared with 12.45 for post-beginning heart rates. The ending heart rates showed standard deviations of 17.29 and 16.7 beats per minute for pre- and post-measurements. The standard deviation of the laps completed was 2.12 and 2.74 for pre- and post-numbers of laps completed in the twelve minute walk.
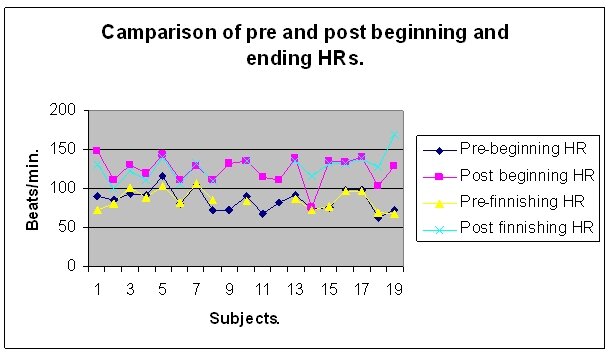
Figure 1

Figure 2
When the parameters were grouped together for an analysis of their trends they showed various interesting patterns. When examined against increasing beginning heart rate, the finishing heart rates while varying, showed a general upward trend as the beginning heart rate increased. When examined against increasing age, there was a downward trend in beginning heart rates as the age increased. The ending heart rates while varying still showed a general declining trend with increasing age. When the measured parameters are examined against each other, for example, with increasing age of subjects, the data shows certain trends. For example the beginning heart rate shows a rising trend as the ages of the subjects increase.
Amongst pre-adolescents the t-test of the pre and post weights yielded a p value of 0.24 indicating no significant statistical change in their pre and post weights. In terms of BMI the t-test yielded a p value of 0.12 indicating no significant change in BMI scores between pre and post measurements of pre-adolescent weight, as shown in Figure 3. The average pacer scores showed a p value of 0.01 indicating no statistical change in pre and post pacer scores despite the appearance of an increase as shown in Figure 3. The pre-average weight of pre-adolescents was 87.1 lbs with a standard deviation of 25.1 lbs, while the post average weight was 89.9 lbs with a standard deviation of 23.8 lbs. The pre-average BMI score was 18.9 with a standard deviation of 3.9, while the post average BMI score was 19.9 with a standard deviation of 3.9
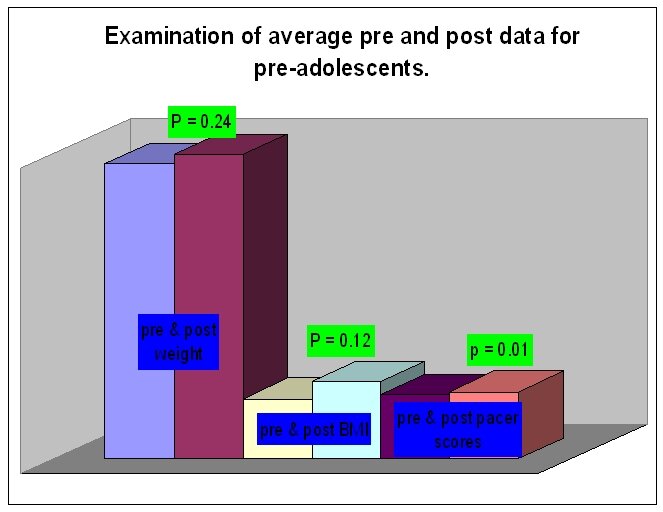
Figure 3
Discussion
Overall, the results did not show significant statistical changes in the parameters measured over the ten week period in both adults and pre-adolescent subjects. There may have been physiological changes or improvements during the program, but this study was not detailed enough to examine those changes. Thus, it is unclear what the physiological effects of the program were on the subjects. The noted trends among adult parameters were predictable in terms of certain known physiological aspects. For example, when the data was re-arranged in terms of increasing age, the beginning heart rates showed an increasing trend, which as Wilmore and Costill (2004) mention is one of many physiological changes seen amongst subjects as they grow older (Wilmore and Costill, 2004).
Also, given that the program was largely self-directed, subjects may not have pushed themselves at intensities that would have produced statistically different results from those in the pre-measurements. However, LaPorte et al. (1984) have shown that even at relatively lower intensity exercise, subjects do show health benefits from regular physical activity. Among adult subjects adherence to the program was a challenge towards the end. Yet, this may not be an adequate reflection of adult physical activity given that the pedometers measure steps taken during physical activity such as walking which subjects must have been involved in. Thus, it is possible that subjects were not entering or reporting some of their steps, but kept with the program.
While there were no significant statistical changes, there were, nevertheless, interesting changes in some of the subjects. In general most pre-adolescent subjects had increased weight compared to their pre measured weight. Yet they also showed some increases in the numbers of laps they were able to complete with the pacer test. It is not conclusively clear how this increase in weight might be explained in light of the increase in pacer scores. While the ten week period was too short for conclusions to be drawn about the sources of increased body weights among children, various studies have been done that examine changes in children as they grow. Bass (2000) noted that children show increased weights, among others, due to increasing bone density and growth at the periosteal regions of their bones.
Conclusion
It is clear that in terms of high, and many a time, lofty goals like reduction of weight and large short term increases in physical fitness, the program, may not be the answer, especially in a short span of time like ten weeks. Results may vary for longer spans of the same program. However, it is also important to note that different individuals respond differently to exercise, and that even small amounts of regular physical activity produce useful improvements in health, as noted earlier. Thus, in this light, the program is found to be quite useful. This study was not conclusive enough because it did not adequately examine the physiological changes in the subjects as a result of the program. Also, the ten week period may be too short to examine the effects of the program adequately. A further improvement in the study, should it be attempted in future, may be to have a control group, which would help contrast better the effects of the program on subjects.
In the end, the program highlighted a familiar challenge facing physical educators and health professionals, adherence to exercise. After starting off with enthusiasm, participants generally reduce their physical activity, possibly after seeing little or no improvement. Adherence seems to be linked to education and awareness of the individualized effects of physical activity. Further research into the knowledge of the individuality of responses and effects due to physical activity in the public may yield a better understanding of adherence, and consequently, further strategies to improve adherence to physical activity.
Acknowledgment
I would like to thank my advisors for this research, Dr. Martha Beagle and Dr. Jeffrey McClung for their support and advice throughout the semester, and for inviting me to be a part of the Walk Smart Active Schools Program. My thanks also go to Mrs. Kathy Todd for her tireless help during the project. Lastly, but not least, I would like to thank the Mountain Association for Community and Economic Development (MACED) for their financial support of the Walk Smart Active Schools Program and continued support of other development efforts in the Appalachian region.
References
Bass, S.L. The pre-pubertal years: A uniquely opportune stage of growth when the skeleton is most responsive to exercise? Sports Medicine 30 73-78.
Centers for Disease Control and Prevention. Retrieved from March, 2007 from http://www.cdc.gov/nchs/fastats/hexpense.htm, http://www.cdc.gov/mmwr/preview/mmwrhtml/mm5232a2.htm, http://www.cdc.gov/nchs/products/pubs/pubd/hestats/overweight/overwght_child_03.htm, http://apps.nccd.cdc.gov/dnpabmi/Calculator.aspx
Costill, David L., & Wilmore, Jack H. (2004). Physiology of sport and exercise. Hong Kong: Human Kinetics. 520-521.
He, Xiaoxing Z & Baker, David W. (2004, September). Body mass index, physical activity, and the risk of decline in overall health and physical functioning in late middle age. American Journal of Public Health, 94(9) 1567-1573.
LaPorte, RE., Adams, L.L., Savage, D.D., Brenes, G., Dearwater, S., & Cook, T (1984). The spectrum of physical activity, cardiovascular disease and health: An epidemiological perspective. American Journal of Epidemiology. 120 507-517.
Oliver, Melody, Schofield, Grant. & McEvoy, Erin. (2006, February). An integrated curriculum approach to increasing habitual physical activity in children: A feasibility study. Journal of School Health, 76(2) 74-79.
Patrick L. Schneider, David R. Bassett, Jr, Dixie L. Thompson, Nicolas P. Pronk, & Kenneth M. Bielak (2006, November/December). Effects of a 10,000 steps per day goal in overweight adults. American Journal of Health Promotion. 21(2) 85-89.
State Legislatures. (2007, January). The expanding obesity problem. National Conference of State Legislatures 33(1) 8-8.
Walk Smart Active Schools. Retrieved from February, 2007 from http://www.walksmartactiveschools.com/default_pages/default_home.aspx